LlamaIndex 學習筆記 - Instrumentation 檢查每階段在做啥
目錄
這筆記是建構在 LlamaIndex 官方文件的節錄/實作/追蹤
嘗試的原始碼在 https://github.com/unclefomotw/llamaindex-try/blob/main/src/rag_5.py
WHY #
Retrieval-Augmented Generation (RAG) 本質上是披著幻想的搜尋,可以想成是更親近人類的搜尋
以後再專門寫文講我對 RAG 的看法,總之 RAG 是個有很多階段的流程,就算是最單純的也至少有三階段: recall, ranking, 跟 synthesis (generation)
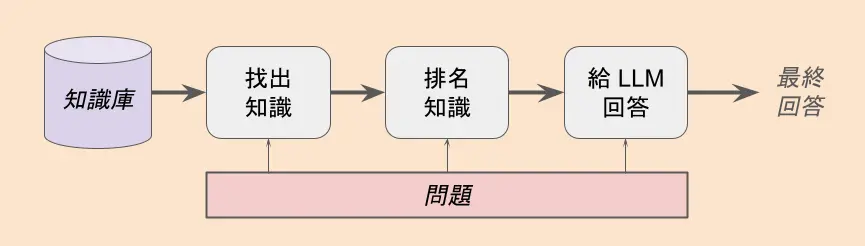
如果 RAG 的答案不令人滿意,每個階段都有可能出錯
- Recall - 想從知識庫拿出相關的知識(候選人),但找不好,跟問題沒有關聯
- Ranking - 雖然有找到相關知識,但排名不好,導致有可能被後續的關卡忽略(如果有的話)或是不被 LLM 重視(現在的 LLM 應該不大有這問題)
- Synthesis - 雖然留下來的知識很相關,但交給 LLM 以後幻想錯誤,回答與期待不符
想 debug 光看最終的解答是不夠的,一種方法是去看每個階段是否符合預期,就像傳話遊戲一樣從哪開始歪掉
在 LlamaIndex 裡面,這個叫做 instrumentation (也可以說是 tracing, observability, …)
Event #
在 LlamaIndex 每個重要的事件都會發出 Event, 記載著種類、時間點、以及事件的詳細內容,例如
- 開始查詢了:使用者的問題是什麼
- 查出相關知識了:每一筆內容是什麼
看原始碼知道,每個 event 會 “dispatch” 送給聆聽的 EventHandler, 讓 handler 收到以後想怎麼處理就怎麼處理;所以最基本的 event handler 長得大概像這樣
class BaseEventHandler(BaseModel):
    ...
    @abstractmethod
    def handle(self, event: BaseEvent, **kwargs) -> Any:
        """Logic for handling event."""
因此,只要寫好自己的 event handler,然後註冊,之後 llamaindex 內部做什麼事情發出 event 的時候,你就可以拿到 event 資訊做進一步處理(不過不是 async, 沒事不要做太累)
import llama_index.core.instrumentation as instrument

class NaiveEventHandler(BaseEventHandler):
    ...
    def handle(self, event: BaseEvent, **kwargs):
        """Logic for handling event."""
        with open("log.txt", "a") as f:
            f.write(self._get_pretty_even_str(event))
            f.write("\n")


dispatcher = instrument.get_dispatcher()
dispatcher.add_event_handler(NaiveEventHandler())
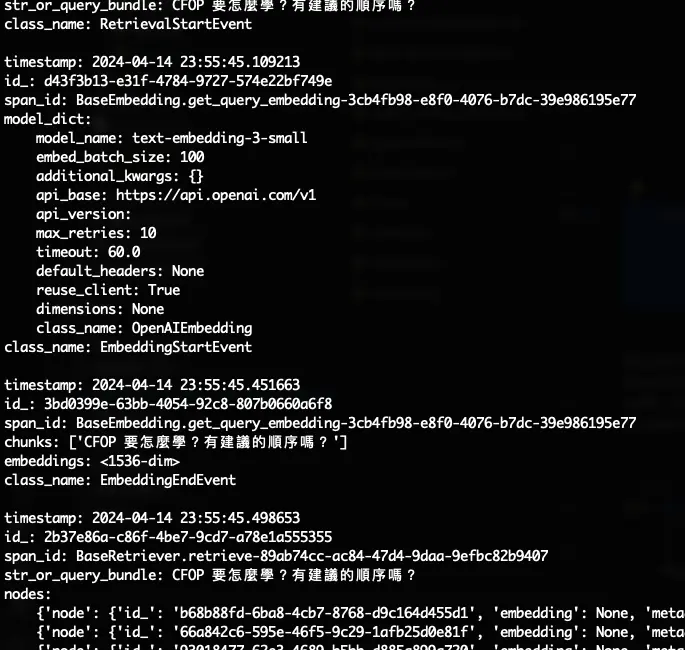
詳見 https://github.com/unclefomotw/llamaindex-try/blob/main/src/rag_5.py 裡面我的實作:單純就是把 event 的內容寫到 log.txt 裡面,內容大概會像這樣
Span #
LlamaIndex 除了單一事件 Event 以外,還引入了 Span 的概念:是一個「階段」、一段時間(例如 “retrieve”)而不是單一個事件點(例如 “retrieve start”),這個在 profiling 也算有用處
例如可以用它內建的 Span Handler 印出每個階段包含了哪些階段,以及各別花了多少時間
import llama_index.core.instrumentation as instrument

dispatcher = instrument.get_dispatcher()
span_handler = SimpleSpanHandler()
dispatcher.add_span_handler(span_handler)

# query_engine query 之後
span_handler.print_trace_trees()
結果
BaseQueryEngine.query-c68ababf-df60-4599-acc5-46b2da8534bb (2.791422)
└── RetrieverQueryEngine._query-82f5d850-bb1e-4932-a7ef-578b1c75c492 (2.790912)
    ├── BaseRetriever.retrieve-4a9f5486-ecca-4570-9d78-8c007093b9f2 (0.430892)
    │   └── VectorIndexRetriever._retrieve-5c749c5f-9ccd-41aa-b39c-3457295a3a96 (0.428559)
    │       └── BaseEmbedding.get_query_embedding-e8f555a2-b35f-430c-bad2-9544307baf33 (0.396708)
    └── BaseSynthesizer.synthesize-e265263a-9812-4caa-8642-b80e83f8867e (2.359703)
        └── CompactAndRefine.get_response-b639116c-6a1f-437f-8043-b7c1361840e5 (2.358963)
            └── Refine.get_response-2aec0bed-523b-4e32-baff-330e5744b686 (2.354677)
                └── LLM.predict-f73c3120-00a3-44da-8d49-80d108d35ba0 (2.351834)
詳見 https://github.com/unclefomotw/llamaindex-try/blob/main/src/rag_5.py
Callback? #
其實在 API 裡會同時看到 callback manager – v0.10.20 以後他們推 “instrumentation” 而想要把 “callbacks” decrecate 掉,雖然體感上文件跟周邊還沒很成熟,但再看看原始碼就會比較清楚了。總之我就跳過 callback 囉